
Every number on one page, and filtered with a click.
The dashboard answers the first questions about a site: how many people came, from where, to which pages, on what. The pages beside it answer the next ones: who is here now, how fast the pages loaded, and where people clicked. Everything below is a capture of the real app on the StrataForge Robotics websites.
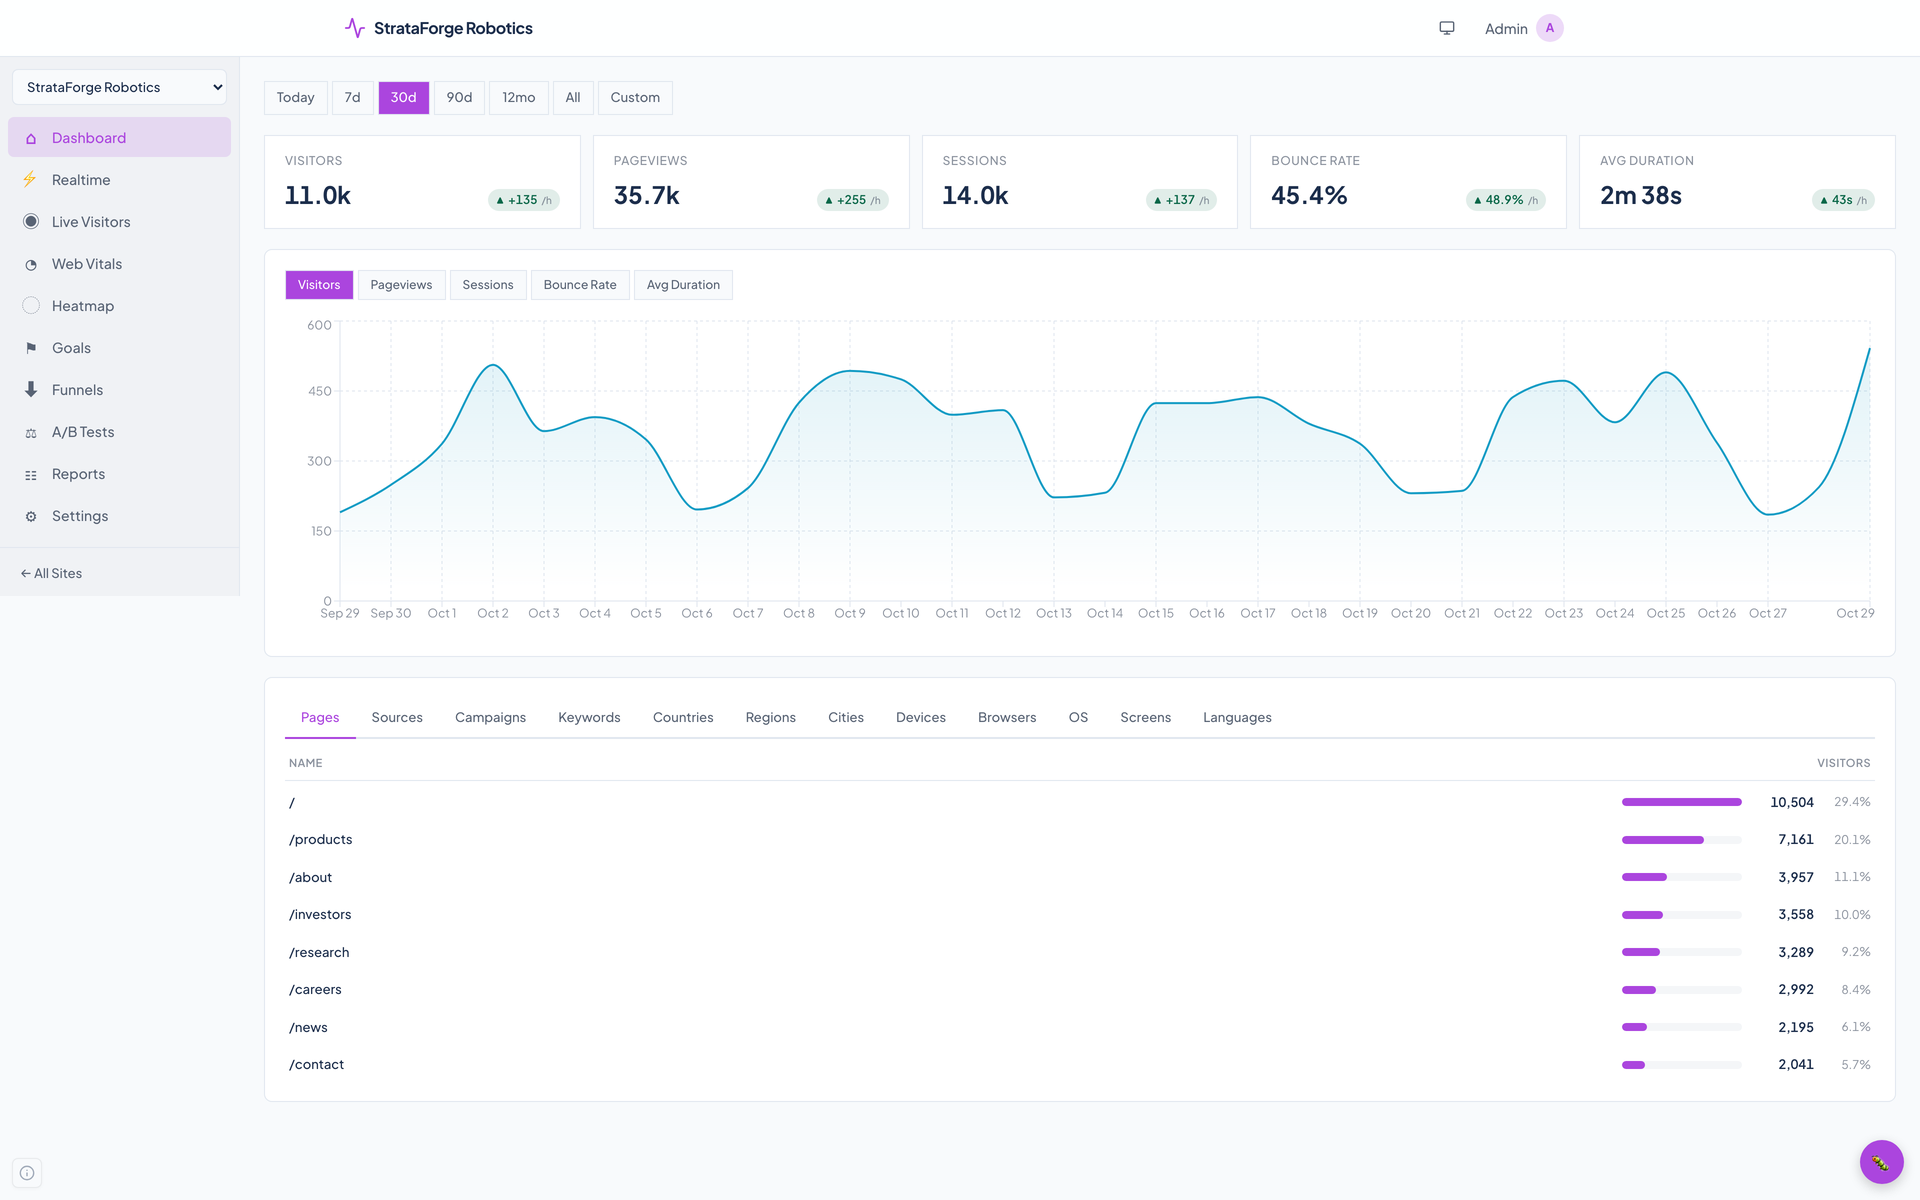
The dashboard
Pick a range, read five numbers, and open a tab.
The top row shows visitors, pageviews, sessions, bounce rate, and average visit length for the range, each with the change over the last hour. The chart under it plots one of the five by hour (for a single day) or by day. Ranges are Today, 7 days, 30 days, 90 days, 12 months, All, and a custom pair of dates.
Clicking a row in any breakdown adds it as a filter, and every number and chart on the page recomputes for just that slice. The filter shows as a chip you can remove.
| Pages | Each page by visitors and share. A trailing index.html is counted as the page itself. |
|---|---|
| Sources and campaigns | The referring site, and the campaign and keyword tags from the address (UTM source, campaign, and term). |
| Countries, regions, cities | Where the connection came from, looked up inside Pulse. The address is never stored. |
| Devices, browsers, operating systems | Read from the browser's description of itself; the description is not kept. |
| Screens and languages | The screen size and the browser's preferred language. |
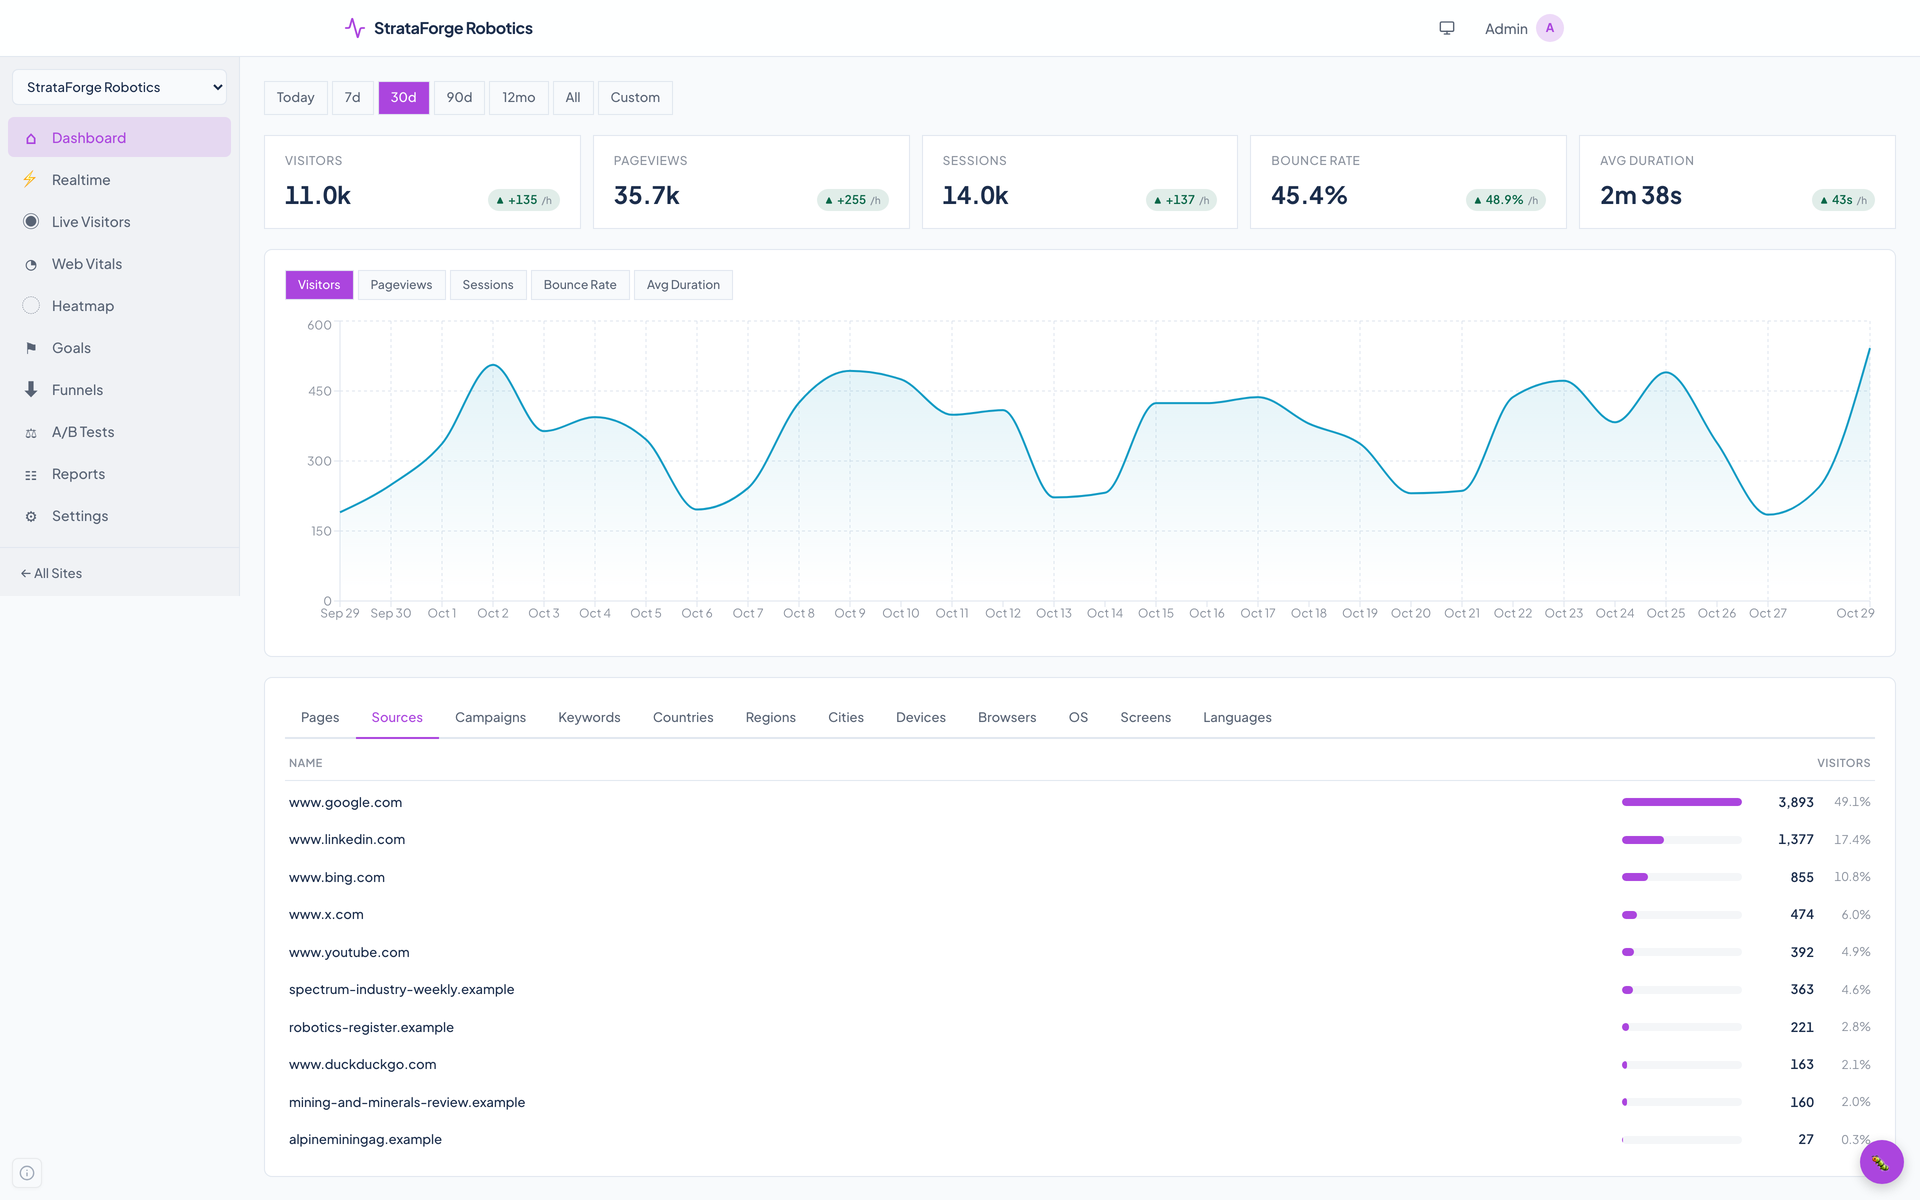
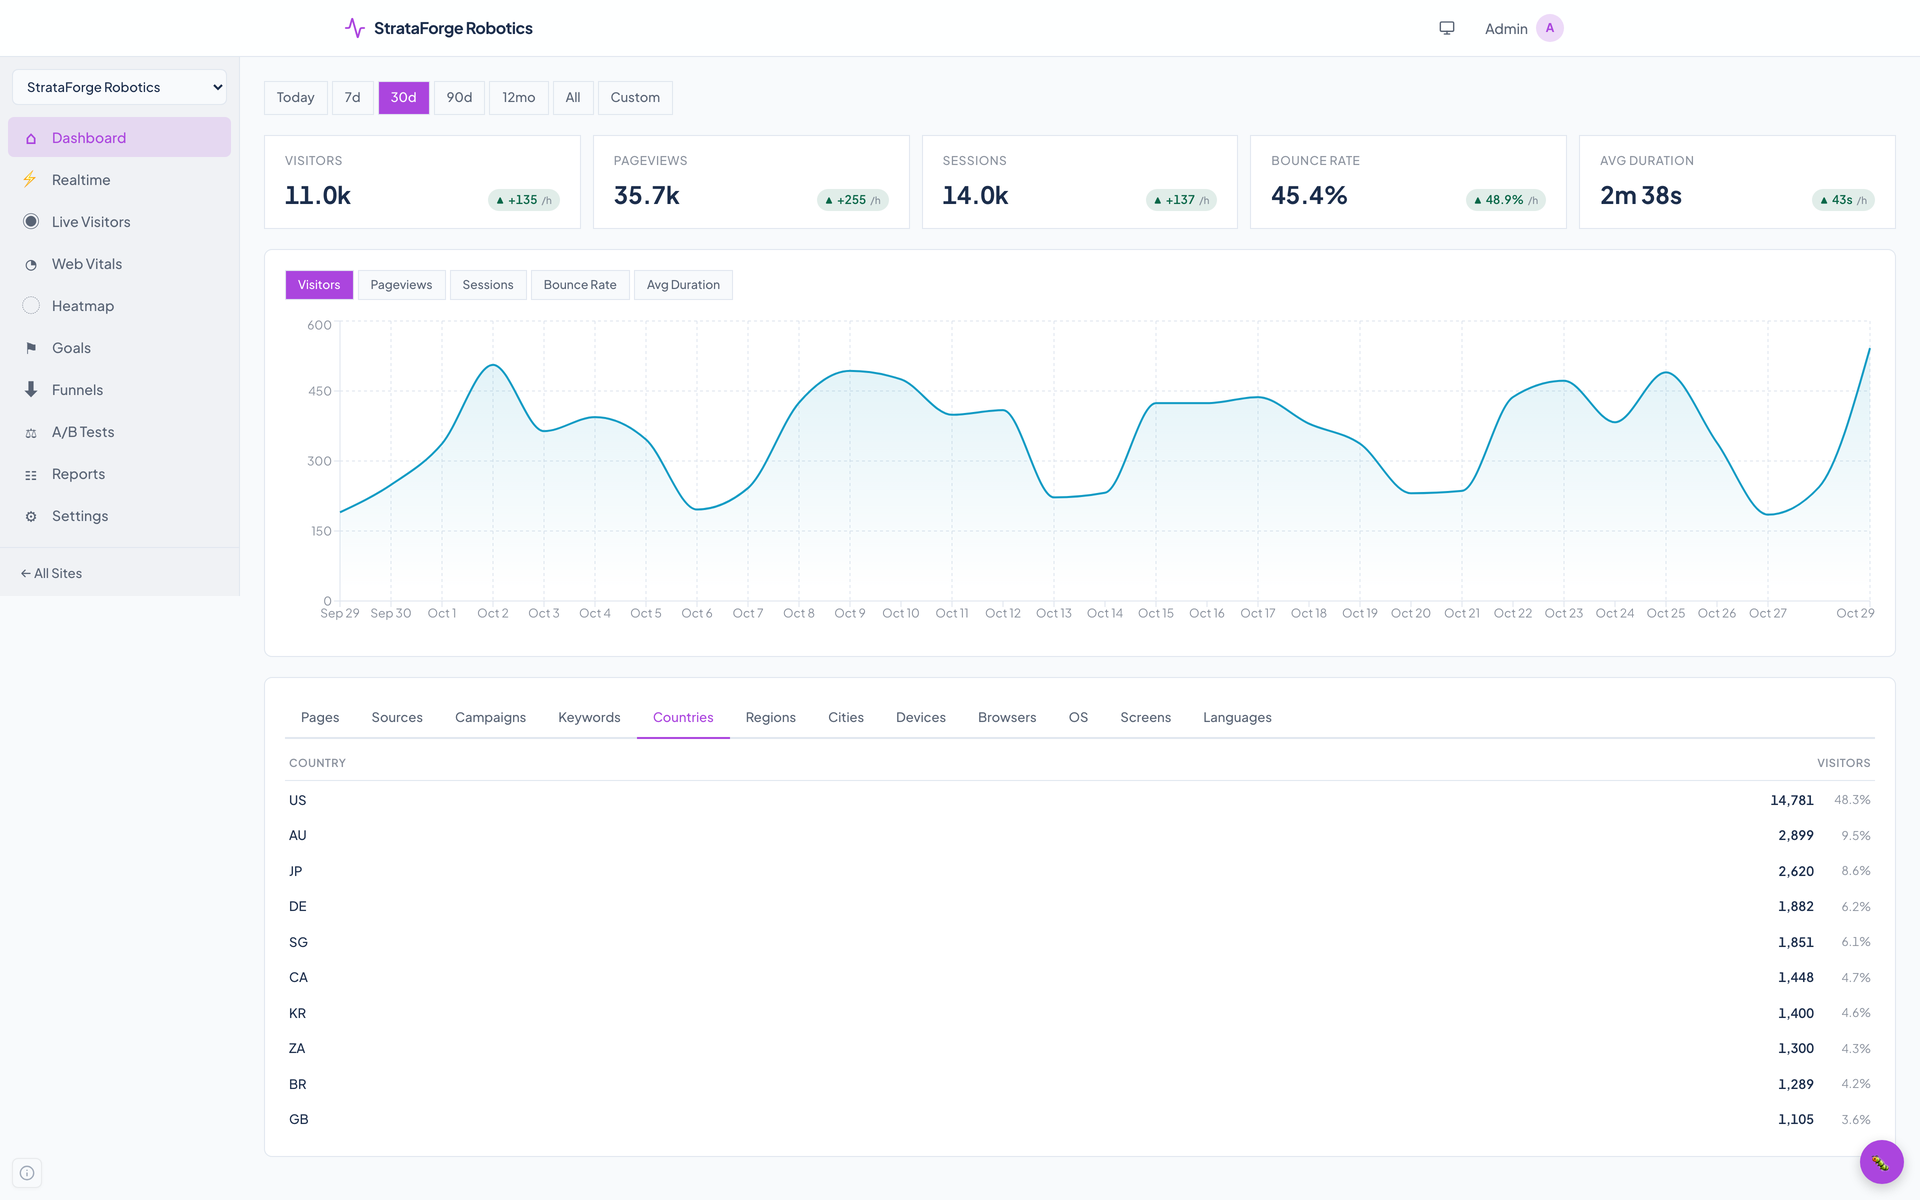
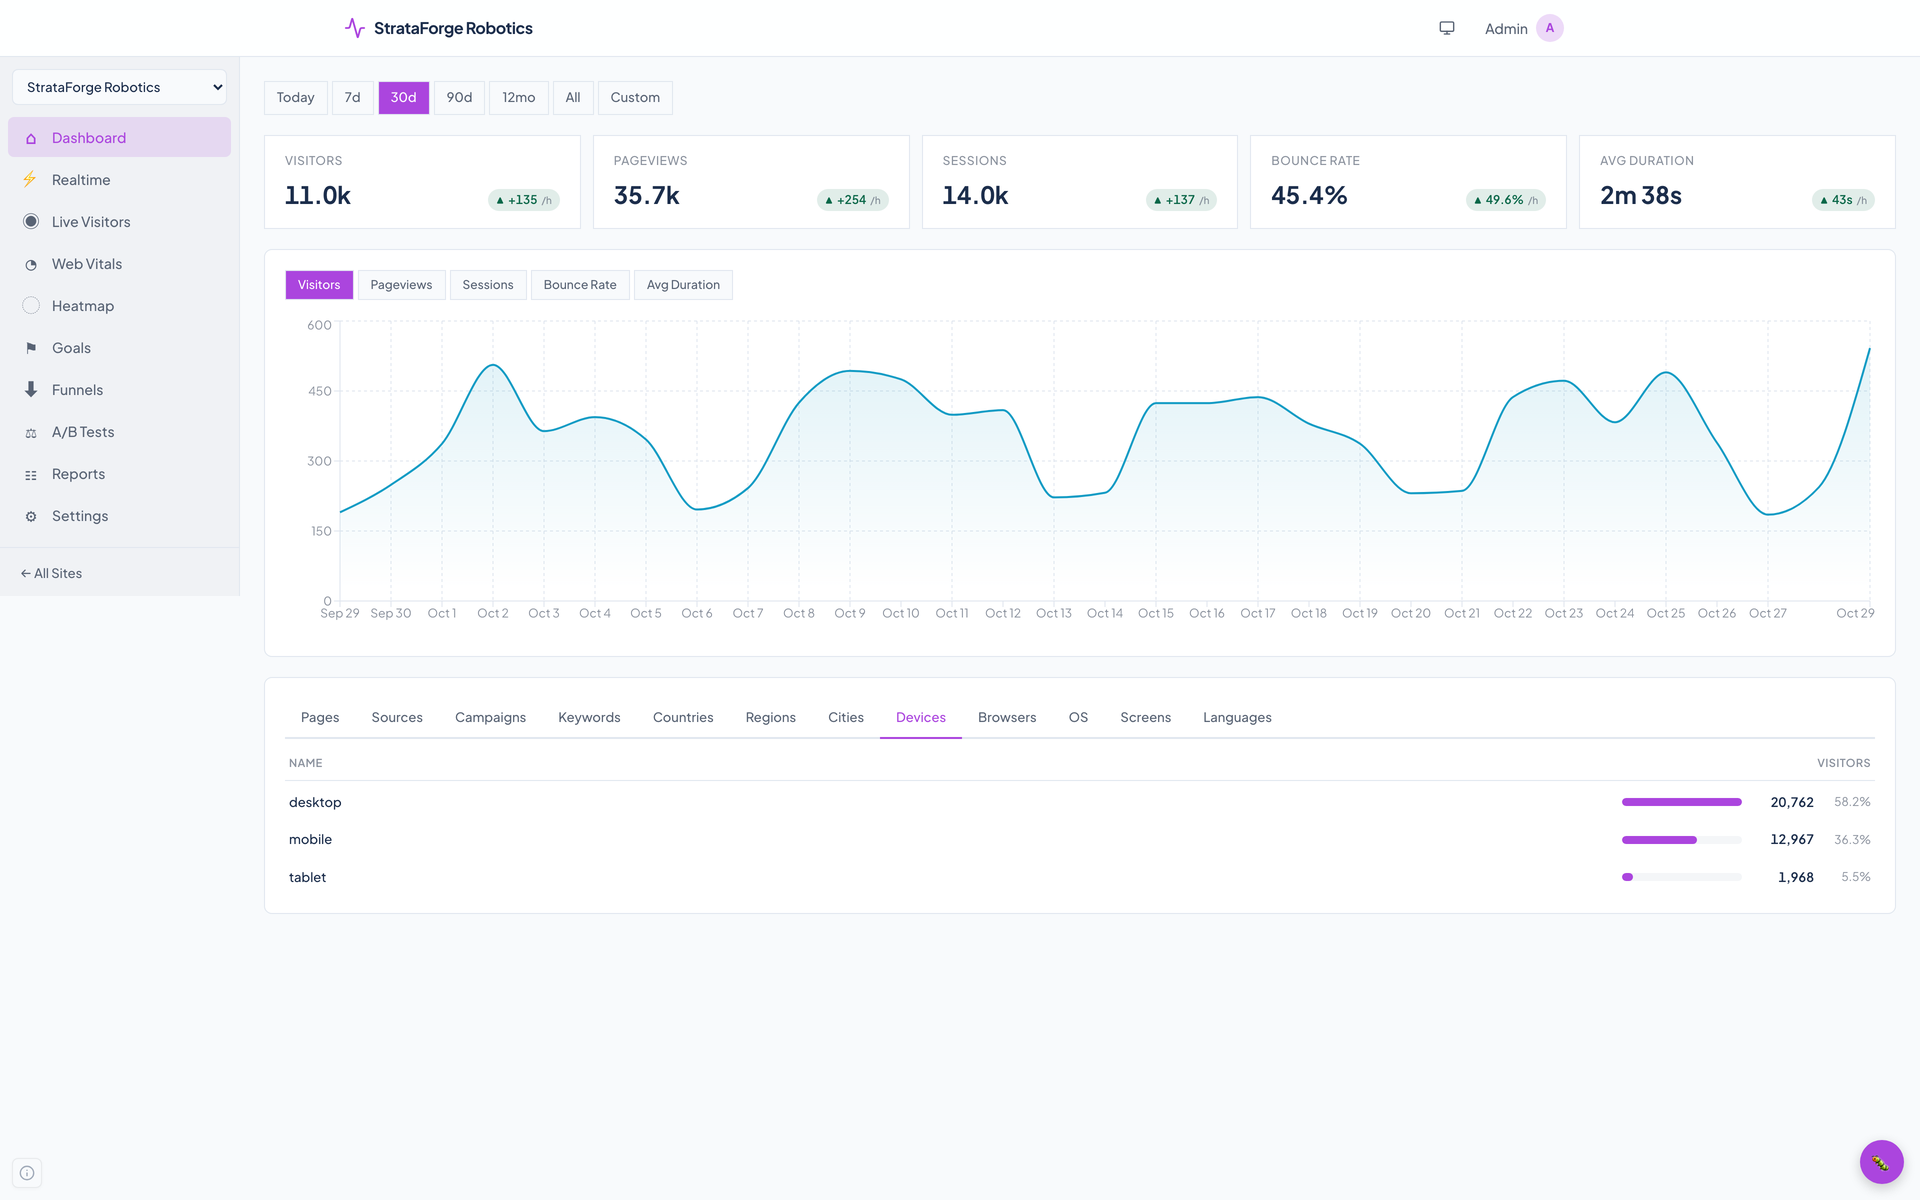
Every figure here is one visit in ten of the dataset's traffic for the six StrataForge sites. Bounce rate and visit length keep the dataset's own values.
Realtime and live visitors
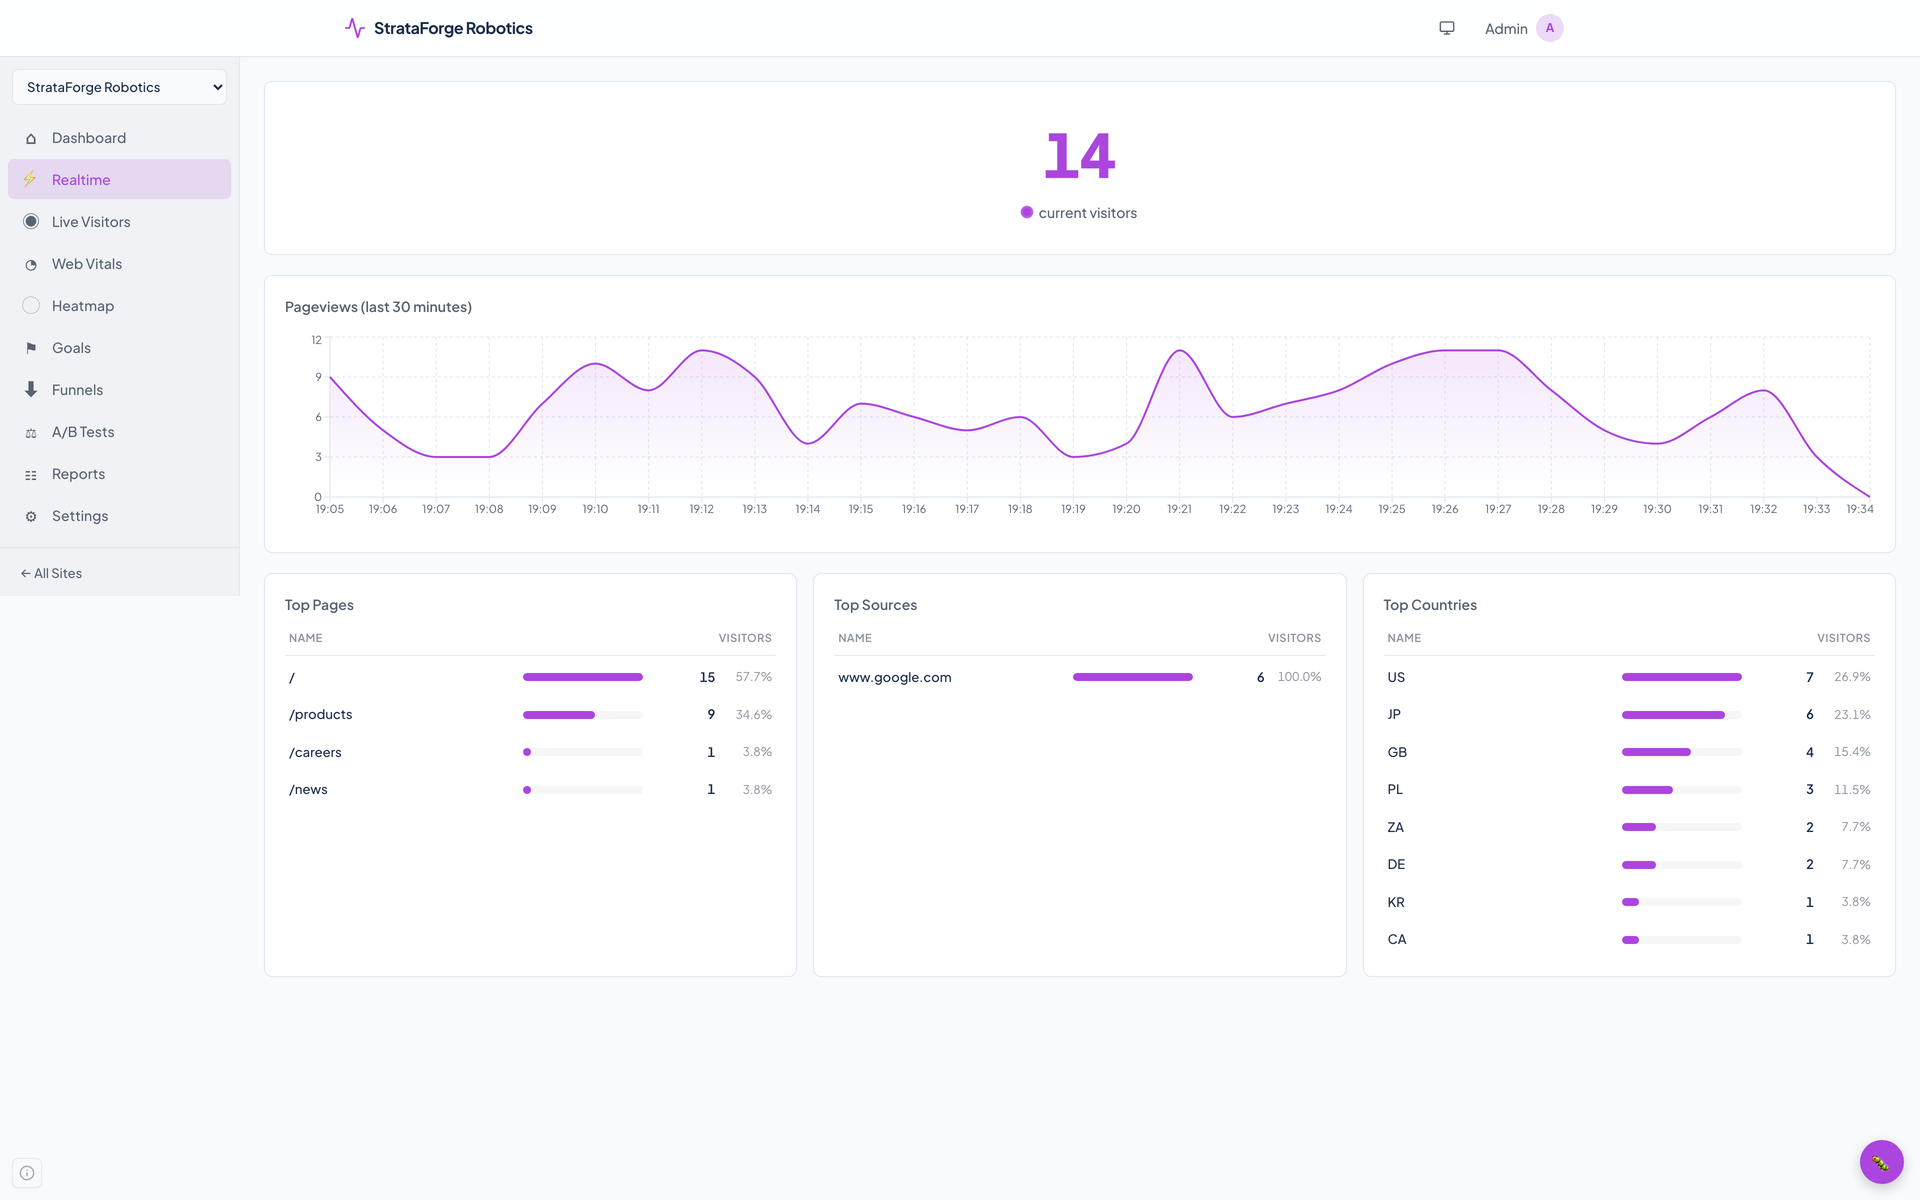
Realtime counts the distinct visitors seen in the last five minutes, charts the last 30 minutes by the minute, and ranks the pages, sources, and countries they are on. Updates are pushed over server-sent events, and the page resyncs from the server every 60 seconds.
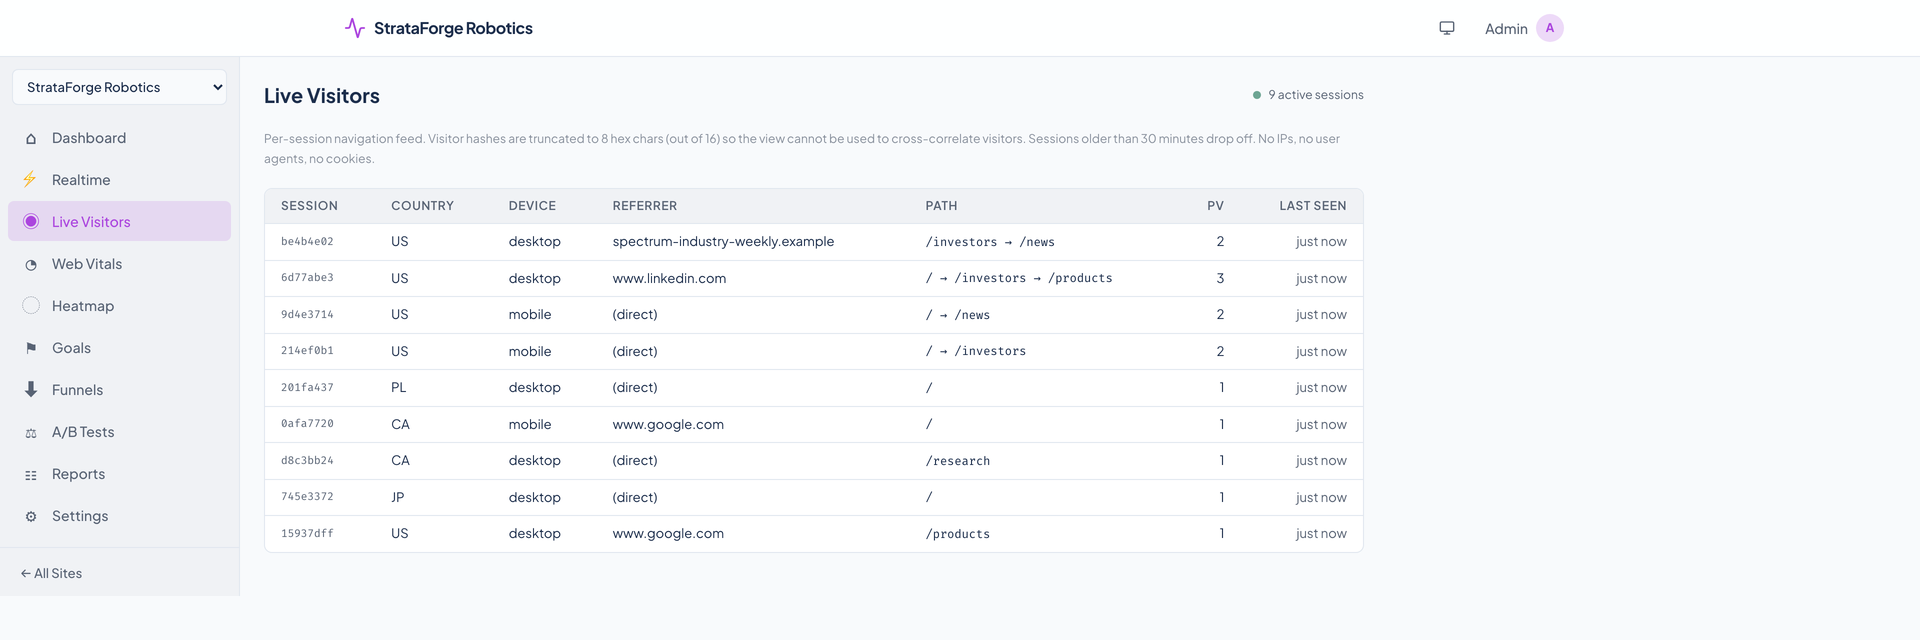
Live Visitors is a feed of sessions as they move. Each row is one session under a short code (the first eight characters of an hourly hash), with the country, device, referrer, the pages seen so far, and when it was last seen. A session drops off after 30 minutes without a pageview, and the page keeps the 50 most recent.
Core Web Vitals
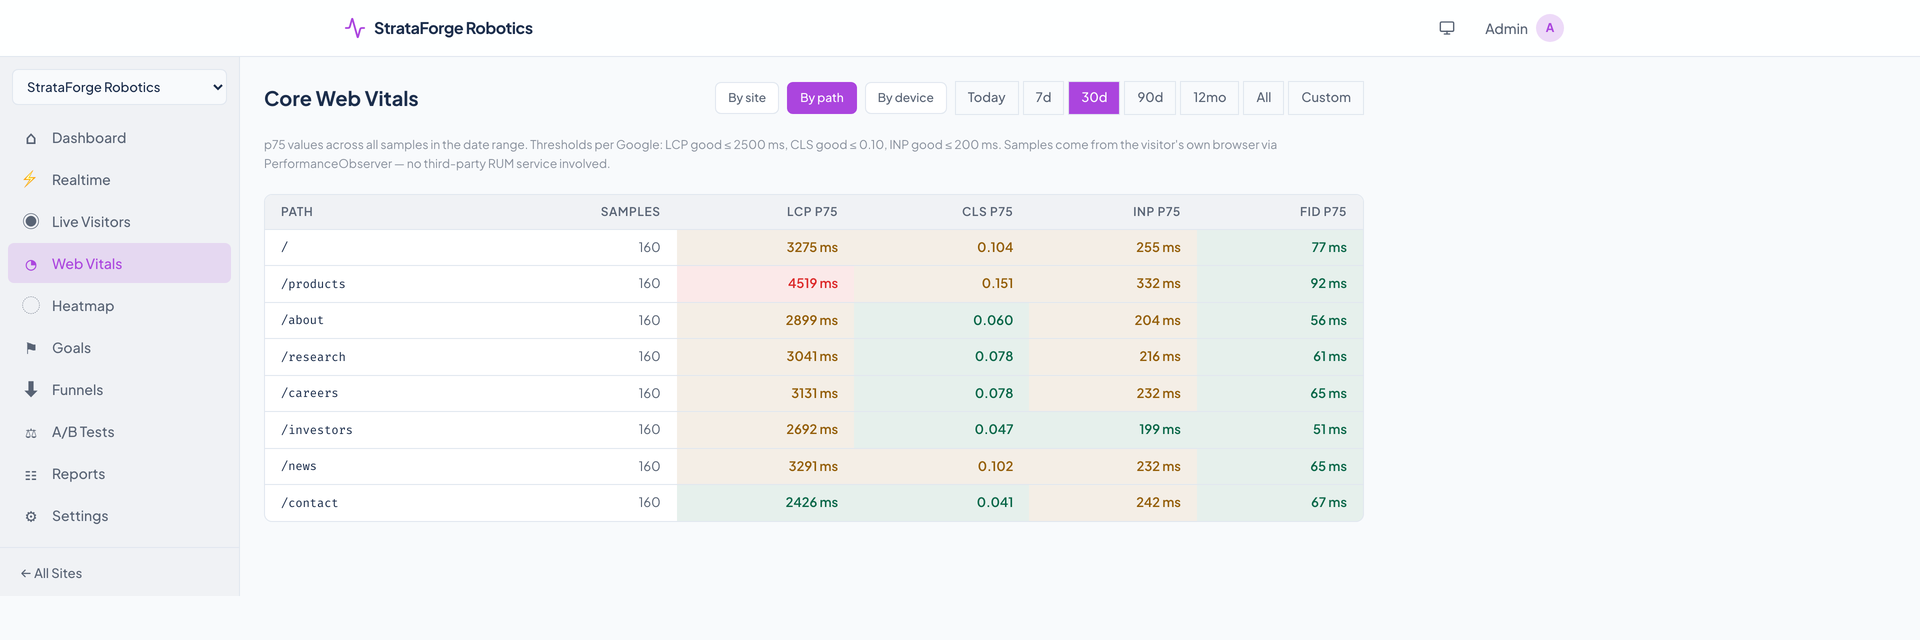
The script measures largest contentful paint, layout shift, interaction to next paint, and first input delay with the browser's own performance observers, and sends them when the visitor leaves the page. Pulse shows the 75th percentile for the site, for each page path, or for each device type, in green, amber, or red against Google's thresholds (for example, largest contentful paint is good up to 2,500 milliseconds).
No third-party measurement service is involved.
Heatmaps
A site turns heatmaps on, then the script records each click as a percentage of the page's width and height and how far down the page each visitor scrolled. Pulse stores no element, no text, and no selector, and shifts each timestamp by up to two seconds so a click cannot be matched to a pageview by time.
The page draws the clicks as a scatter on a plain background, for desktop, tablet, or mobile viewports, with a panel for how many sessions reached 25, 50, 75, and 100 percent of the page.
Sites and settings
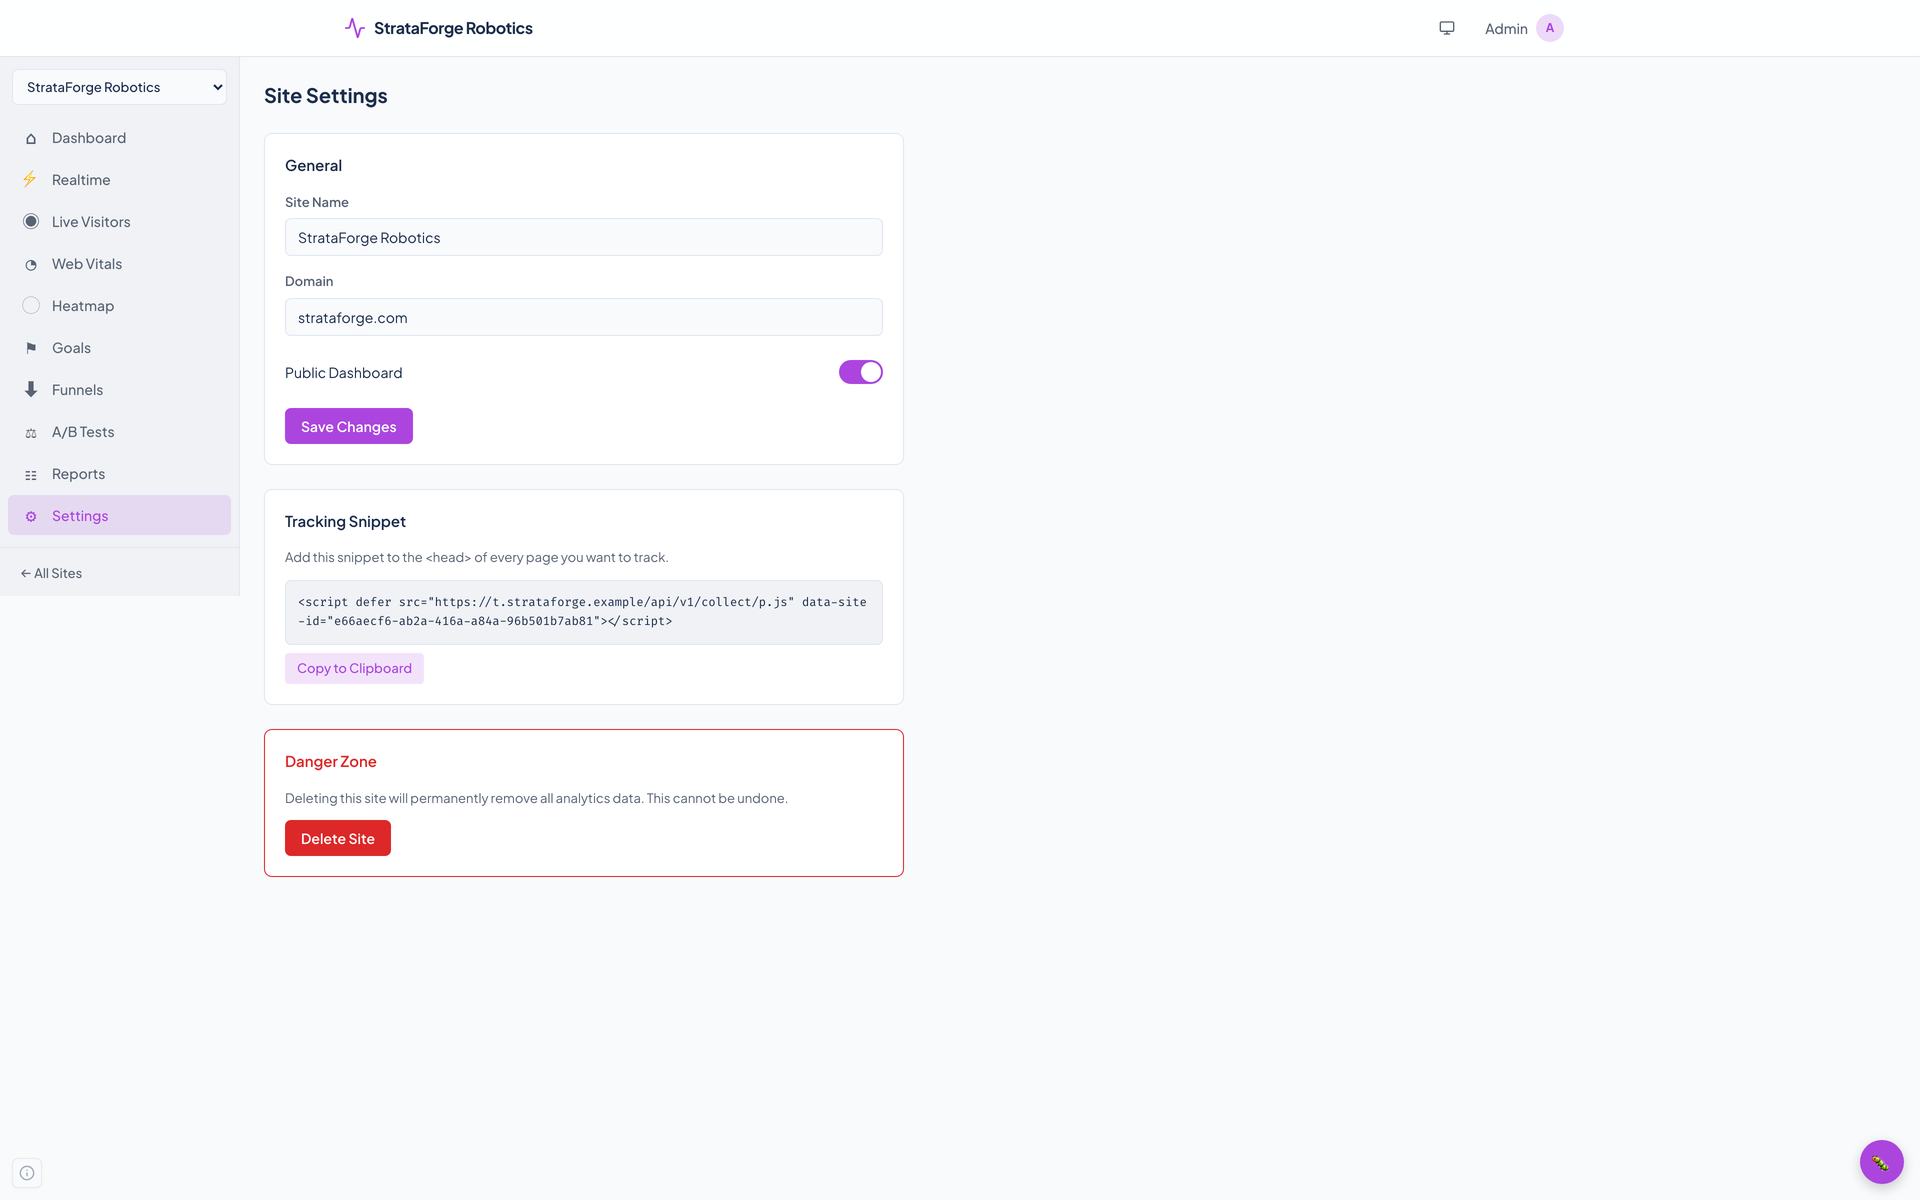
One account can track many sites; the StrataForge account tracks six. A site has a name, a domain, and an install tag, and the Settings page shows the tag for the site you are in.
Questions about this tool?
Write to Renkara Media Group and a person will answer.